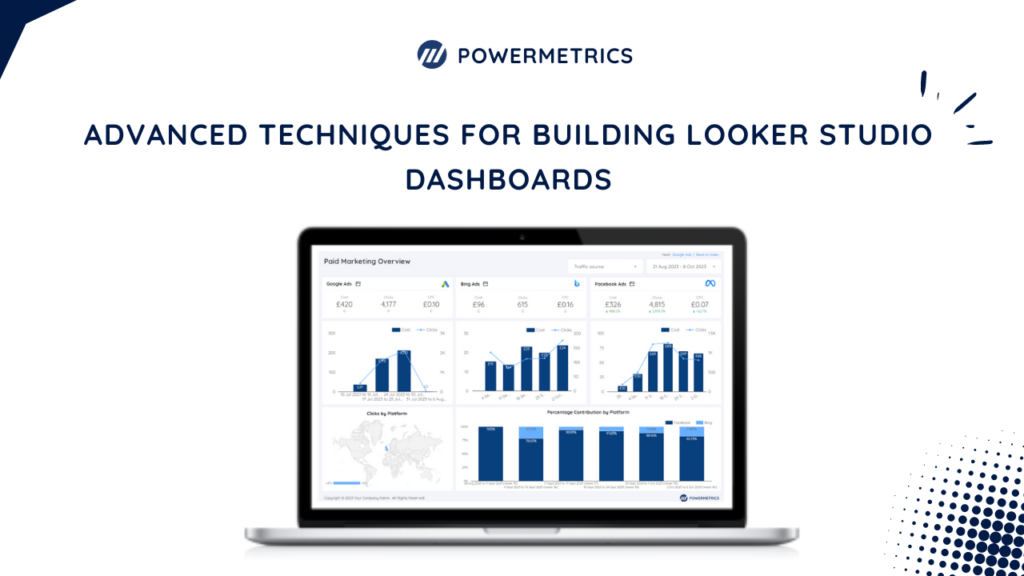
Building effective Google looker studio dashboards requires more than dragging and dropping widgets. To truly harness the power of data visualisation and analysis, you need to employ advanced techniques that enhance usability, interactivity, and insights. This blog post will explore advanced techniques for building looker studio dashboards and provide solutions tailored to specific dashboard templates.
Dynamic Filters and Drill-Downs
One key to creating insightful Google looker studio dashboards is allowing users to interact dynamically with the data. Dynamic filters and drill-downs enable users to explore dimensions and metrics without cluttering the dashboard interface.
For example, in the LinkedIn Analytics Report Template, you can create dynamic filters based on date range, demographics, or campaign performance to enable users to customise their analysis based on their specific needs.
Custom Visualisations and Templates
While Looker Studio provides a wide range of built-in visualisation options, sometimes you must create custom visualisations to communicate your data insights better. For instance, in the Google search console looker studio template, you can customise the visualisation of search performance metrics to highlight trends or anomalies most relevant to your business goals.
Data Blending and Integration:
Many organisations use multiple data sources to gather insights into their marketing performance. Looker Studio allows you to blend and integrate data from various sources seamlessly.
For example, in the All-In-One Marketing Report Template Google Looker Studio, you can combine data from Google Analytics, Google Ads, Facebook Ads, and other platforms to comprehensively view your marketing efforts.
Performance Optimization:
As your dashboards grow in complexity and data volume, optimising performance is essential to ensure a smooth user experience. Query optimization, caching, and pre-aggregation can significantly improve dashboard loading times.
For instance, in the GA4 Ecommerce Conversion Funnel Report Template, you can optimise query performance by pre-aggregating data at different conversion funnel stages to reduce query execution time.
Conclusion:
Mastering Google looker studio dashboards requires a combination of technical expertise and creative problem-solving. By implementing advanced techniques such as dynamic filters, custom visualisations, data blending, and performance optimization, you can create dashboards that empower users to make data-driven decisions effectively.
Whether you’re analysing LinkedIn campaign performance or tracking YouTube channel metrics, these solutions can help you unlock the full potential of looker studio for your organisation’s data analytics needs.

