Drill down is a functionality within Google Data Studio that empowers users to delve deeper into their data, offering a means to transition from a broader, top-level perspective to a finer-grained examination through interactive engagement with visual representations.
This feature facilitates a seamless transition from a bird’s-eye view of your data to a more intricate analysis, allowing you to interact with your visualizations and progressively uncover more detailed insights, ultimately enhancing your data exploration experience.
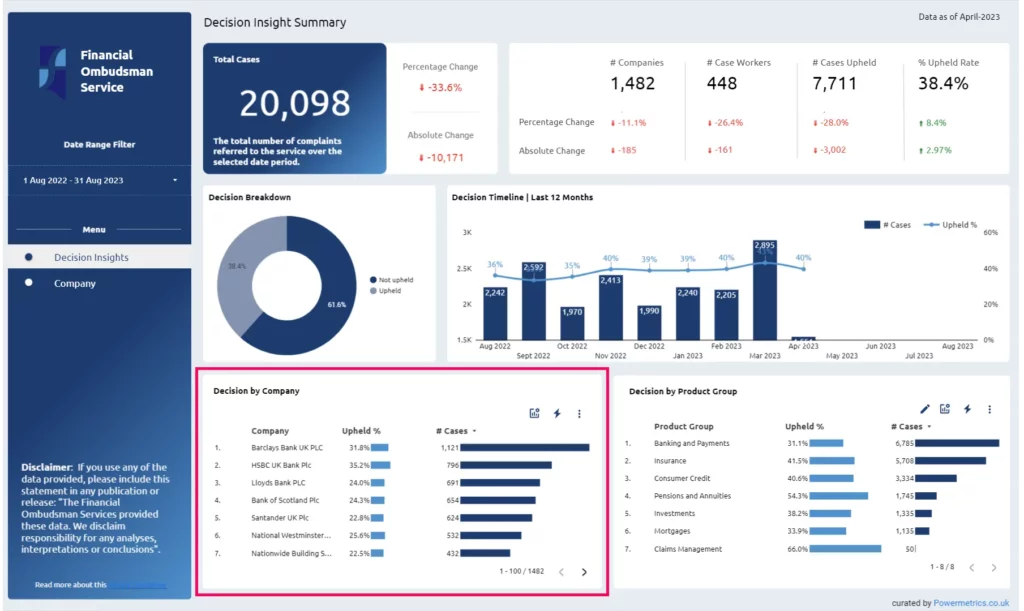
Click on the Table Chart where you would like to add the drill-through functionality.
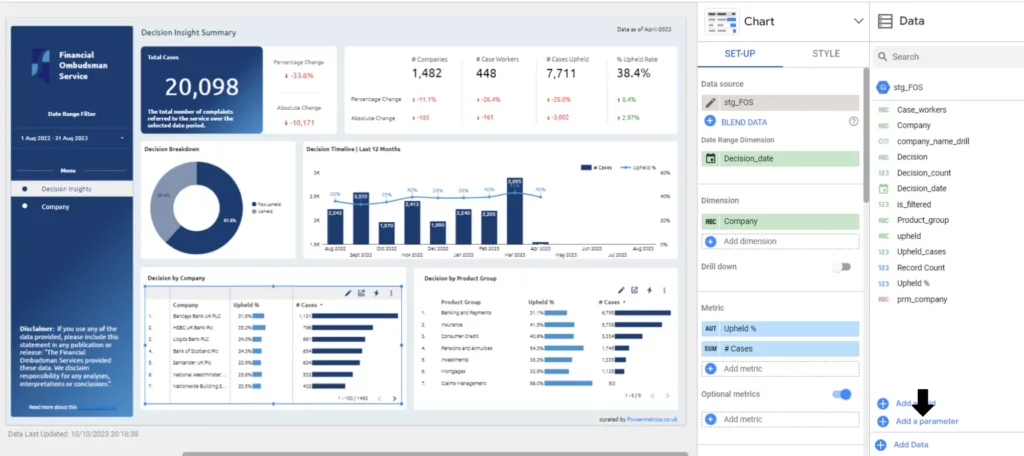
Add URL parameter
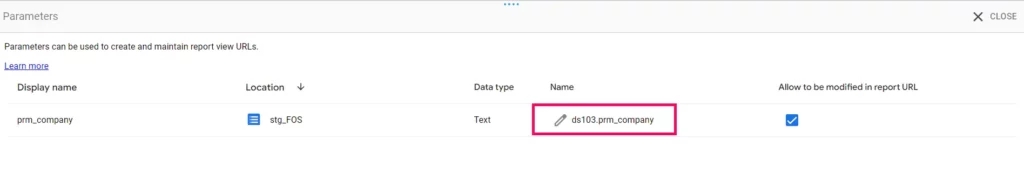
As the first step in the drill-through method, create a Company parameter. To do this, click on Add a parameter which is located in the bottom right corner.
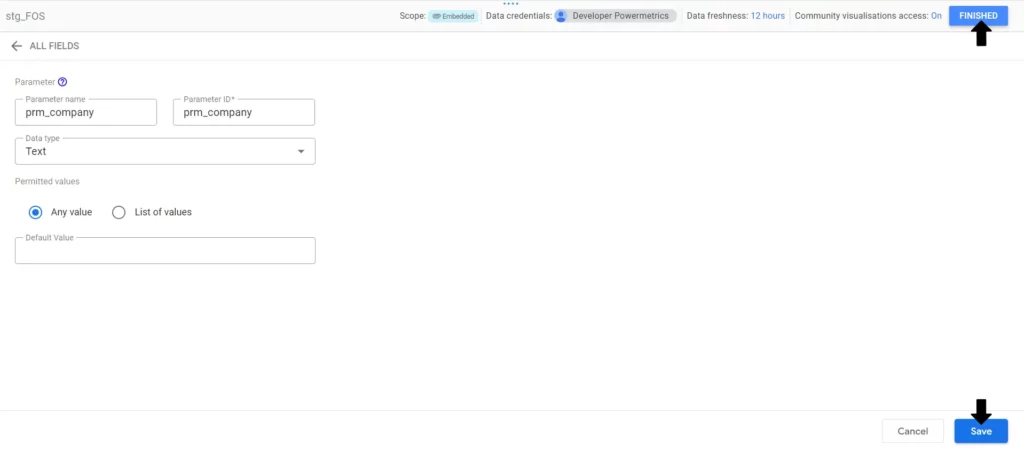
Add the Parameter name and Parameter ID and the data type to text . After completing this click on Save and Finished.
Creating a drill down field
Now, create a new calculated field by clicking on the Add a Field option in the bottom right corner.
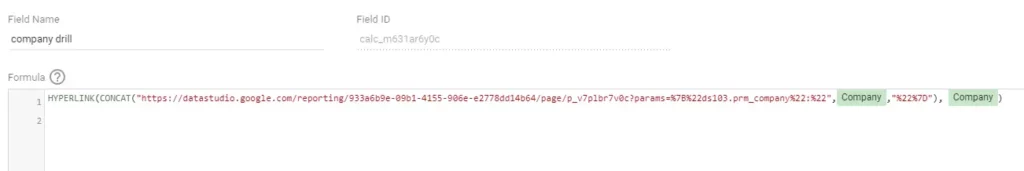
This is the crucial step; create the calculated field using the following formula
[destination_tab_url] – Replace your destination page URL.
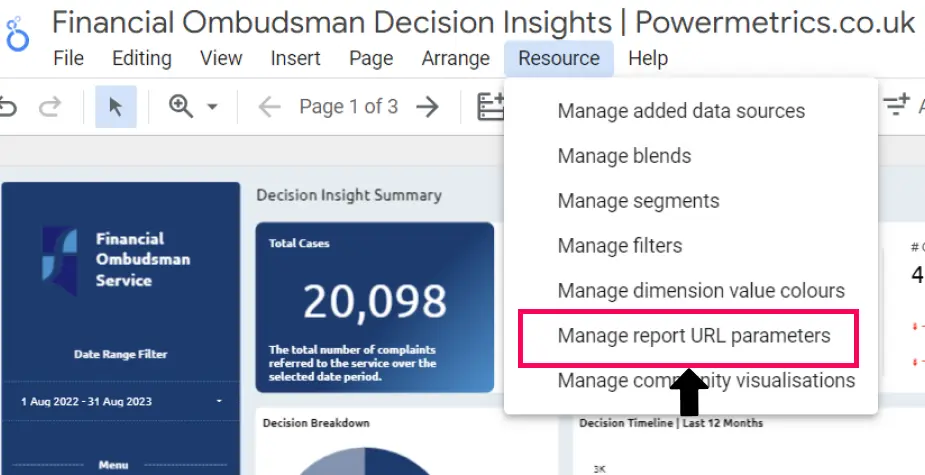
[url_parameter] – Click on the Resourcetab , Select Manage report URL parameters from the dropdown , you’ll see a pop-up from below . Please copy the name and ensure that the checkbox is checked .
[Dimension] – Select the Company dimension .
Provide a field name, and then click ‘Save and Finish.’ This action will create links with clickable hyperlinks
Add the created Dimension to the Table Chart.
Elevate Your Marketing Game with our Intuitive Website Master Template
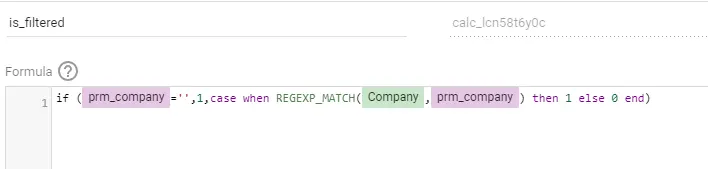
Now create another calculated field for filtering the company dimension with the new calculated field dimension.
IF([param_name] = ‘ ‘, 1, CASE WHEN REGEXP_MATCH([Dimension], [param_name]) THEN 1 ELSE 0 END)
[param_name] – Add the parameter field name which we created.
[Dimension] – Select the Company Dimension.
Give a field name and click on Save and Finished.
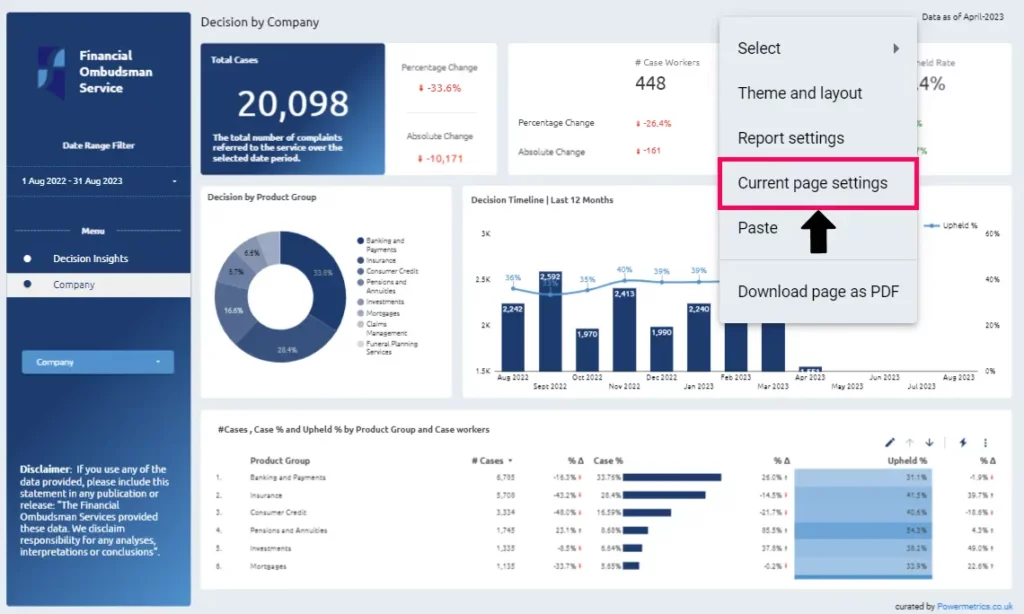
Go to the Destination Page you want to drill through and Right click . Then click on the Current Page Settings.
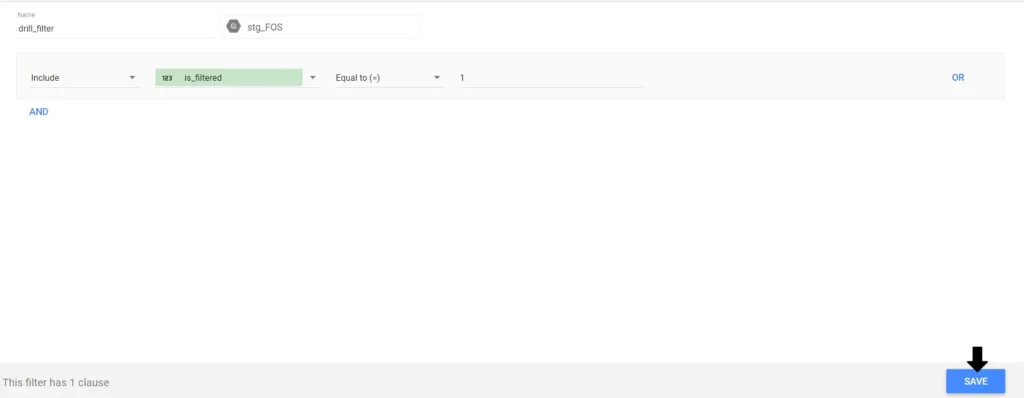
Create a page level filter
Add a Page level filter for filtering the Company using the created calculated field.
Now, you can utilize this method to drill through to another tab and test your dashboard.
Enhancing your data storytelling
Creating compelling data stories through well-designed charts is a powerful skill. Adding drill-down features to your reports is a great way to make your data shine.
Let your data speak for itself and leave a lasting impression on your audience. Looker Studio’s drill-down tool is user-friendly and customizable.
Discover Powermetrics’s collection of templates on Google Looker Studio. See how our looker studio templates can boost your digital reports quickly.
Explore insightful data with ease using Looker Studio Templates. Click to view and analyze pre-built templates for actionable insights at your fingertips.