Home > Looker Studio Template Gallery > Property Market Analytics (Data Pipeline and Dashboard)
Property Market Analytics (Data Pipeline and Dashboard)

Regular Price
£1,999
The Proptech BI tool provides you with real-time insights into the property market sourced from HM Land Registry, including five years of historical capital growth data calculated specifically for the defined local area which can help you identify areas with the potential for high returns and make informed investment decisions. With our dashboard and data pipeline you can stay ahead of the market and make timely investment decisions.
Product Description
Why choose our property market analytics dashboard?
Our property market analytics dashboard comprehensively explains property trends, price growth, and investment opportunities across different regions and property types. Whether you’re a buyer, seller, or investor, our interactive visualizations and data-driven analyses empower you to make informed decisions.
- Explore critical insights: Our real estate market analysis dashboard provides a wealth of information about the real estate market, including historical trends, current market conditions, and future forecasts. This information can help you identify investment opportunities, manage your portfolio, and make better decisions overall.
- Track market dynamics: Our proptech BI tool lets you track market dynamics in real-time. This means you can always stay up-to-date on the latest trends and adjust your plans as needed.
- Uncover hidden opportunities: Our Hm land registry data dashboard uses advanced analytics to uncover hidden opportunities in the market. This means that you can find investments that other investors may have missed.
What is included in the real estate dashboard ?
With powermetrics user-friendly, fully customizable property data analytics dashboards, you can easily visualize your data and identify trends that can help you improve your performance.
Here are some of the real estate KPIs that you can track with Powermetrics:
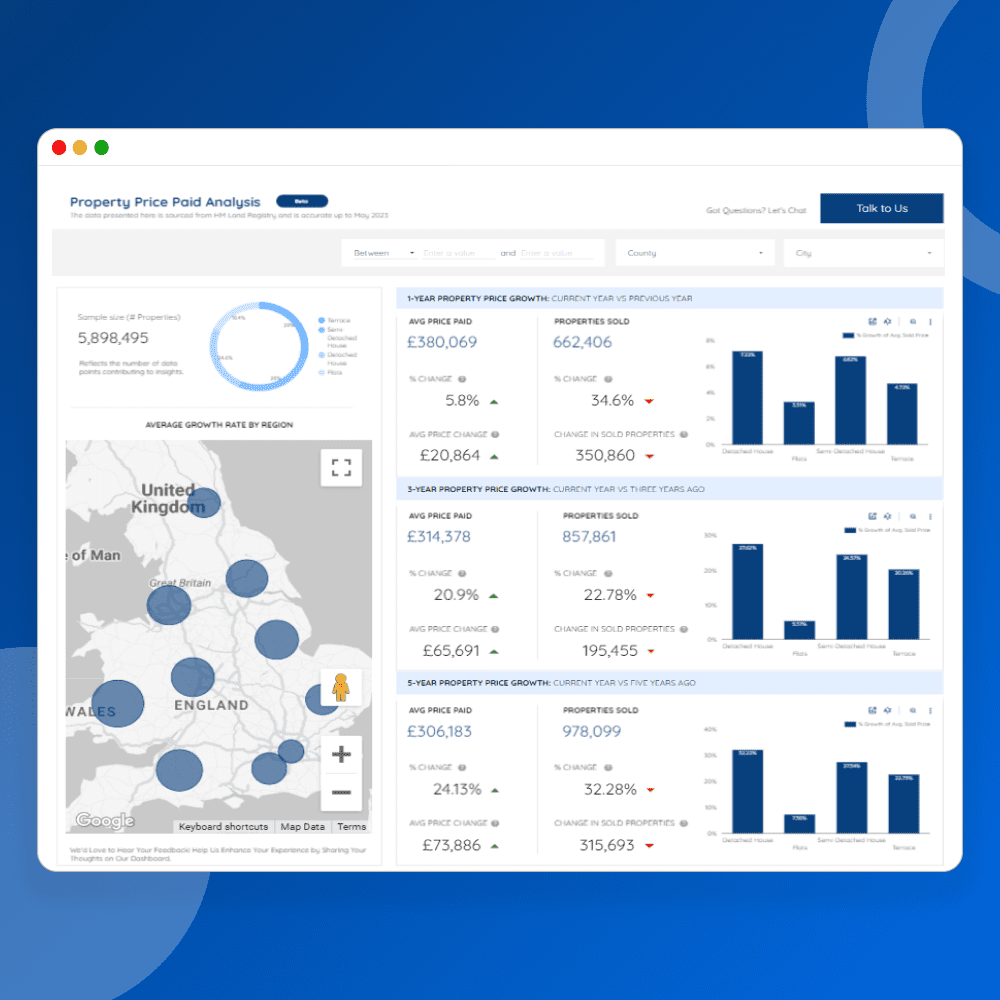
Overview Get a snapshot of property market trends on our Overview page. Discover median price growth for different property types over 1, 3, and 5 years. Use an interactive heatmap to spot high-growth areas across regions. Filter by property type and explore annual growth rates with interactive charts.
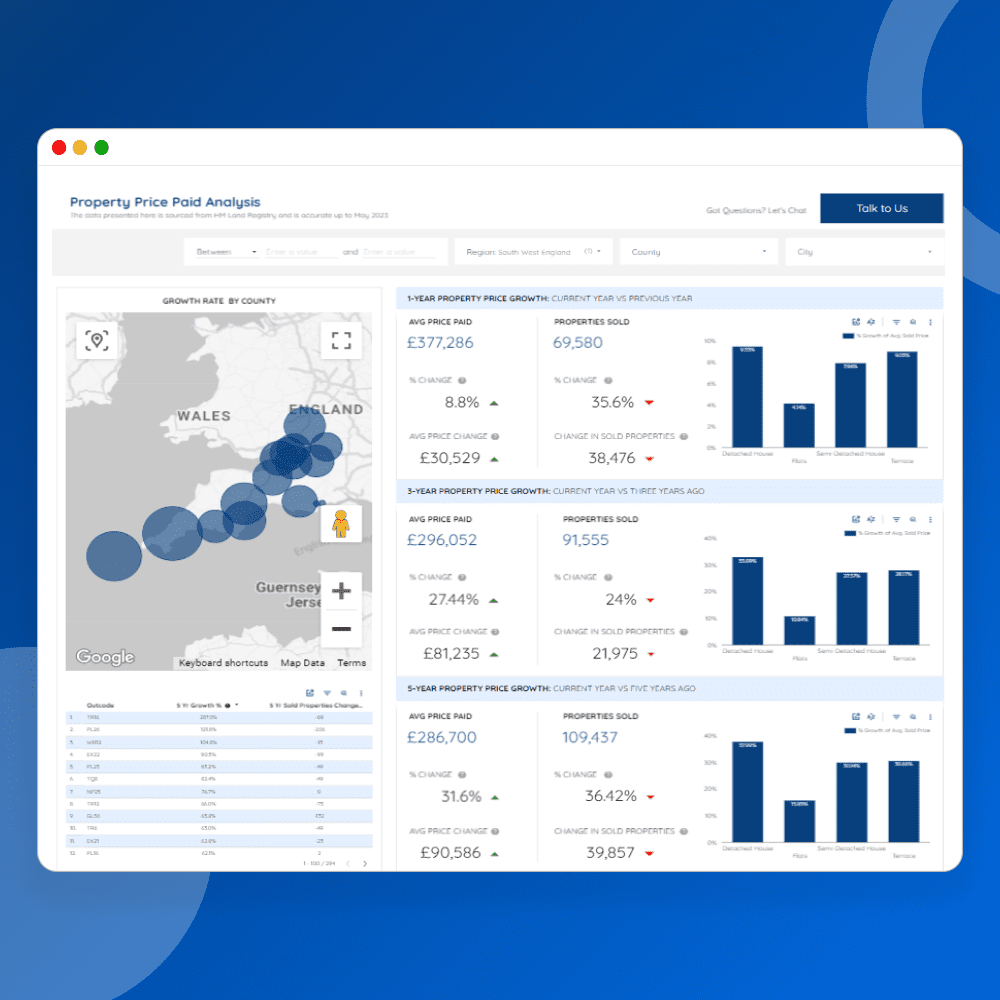
Region Analysis Delve into regional insights on our Region Analysis page. Visualize price growth for your chosen property type across different regions. Use filters to narrow down regions, and explore price trends over time with maps and charts. Identify top-performing districts for potential investments.
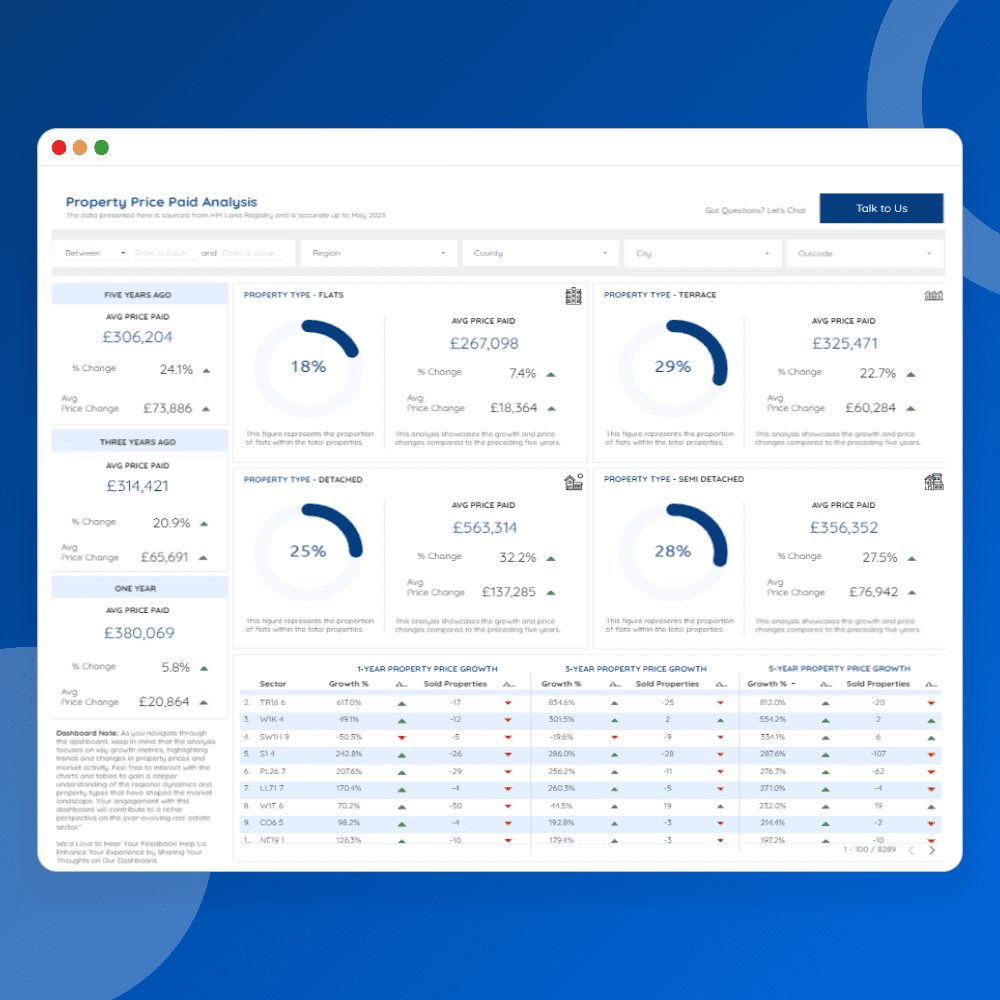
Property Type Analysis Compare property types on our Property Type Analysis page. See price growth differences for flats, terraces, semi-detached, and detached homes. Filter by region, district, or sector to explore trends further. Understand property prevalence with distribution charts.
Experience our user-friendly property insights dashboard for informed real estate decisions.
Product Reviews
From 2 reviews
Regular Price
£1,999
The Proptech BI tool provides you with real-time insights into the property market sourced from HM Land Registry, including five years of historical capital growth data calculated specifically for the defined local area which can help you identify areas with the potential for high returns and make informed investment decisions. With our dashboard and data pipeline you can stay ahead of the market and make timely investment decisions.
Get Custom Dashboard
Looking for a custom dashboard solution? Our team of experts can create a custom Looker Studio solution that aligns perfectly with your unique needs
Recommended Templates
£1,999
Jane
It's like having a real estate crystal ball. The interactive charts and region analysis gave me insights I never thought possible
Alex Turner
As a real estate enthusiast, I've been on the lookout for a tool that can provide comprehensive insights into the market. This dashboard exceeded my expectations. The interactive heatmap allowed me to identify high-growth areas effortlessly, and the detailed property type analysis helped me understand trends better. The region analysis page with its map visualization is a game-changer. I can easily track price growth and find investment opportunities. The user interface is intuitive, and the data-driven approach empowers me to make informed decisions. I would say it is a must-have for anyone in the property market!