Encountering zeros, unknowns, or empty fields in Looker Studio dashboards often signals missing values, including null and N/A. While common, they’re not ideal for your reports. Your initial instinct might be to remove them, but that can create more issues than it solves, impacting your analysis and leading to inaccurate conclusions.
In this tutorial, we’ll explore effective methods for managing missing values in Looker Studio, ensuring reliable analysis, and sharing valuable tips to avoid pitfalls.
Missing data, similar to duplicates, can complicate data analysis and present under various labels: Null, Unknown, NA, 0 .The best approach to handle this is usually revisiting the data source for cleanup. However, there are reasons to address it within your visualization tool, like a small dataset, avoiding additional tools, data access constraints, or report customization needs.
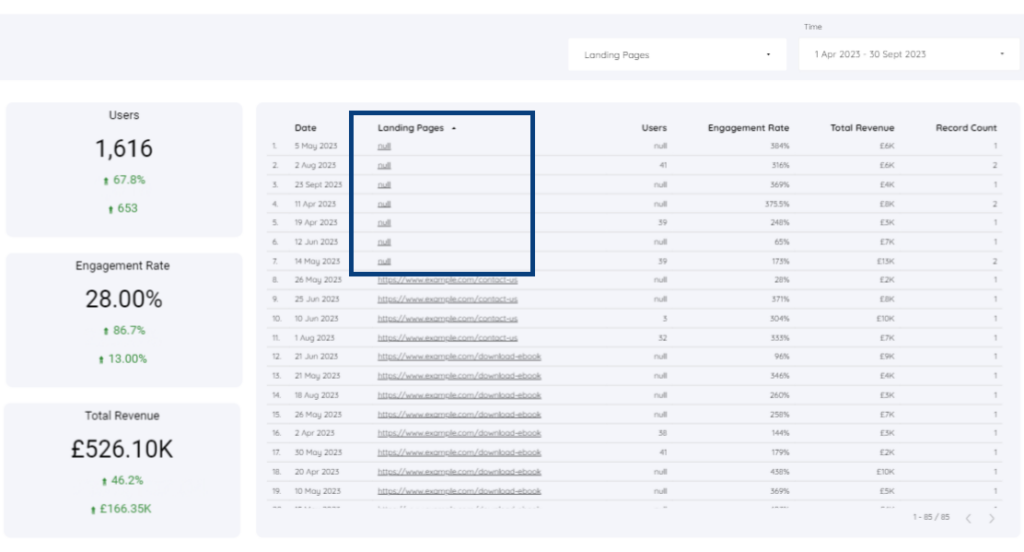
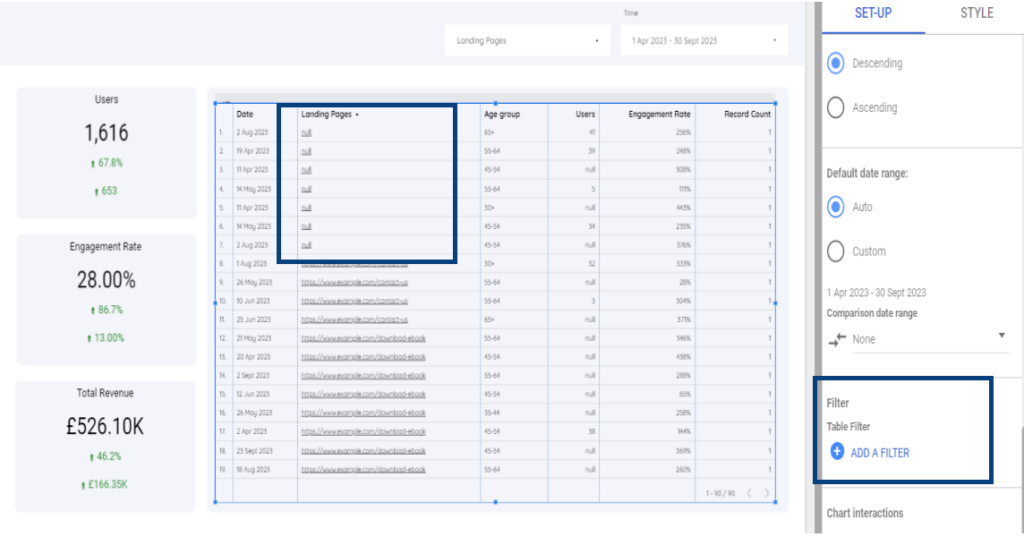
Our first step is to identify missing data. One way is to take a broad look at your dashboard for any signs of gaps.
For example, inspect the time series chart breaking down campaigns by URLs.
In the legend, you’ll notice ‘null,’ indicating missing data in Looker Studio, confirming gaps in this chart.
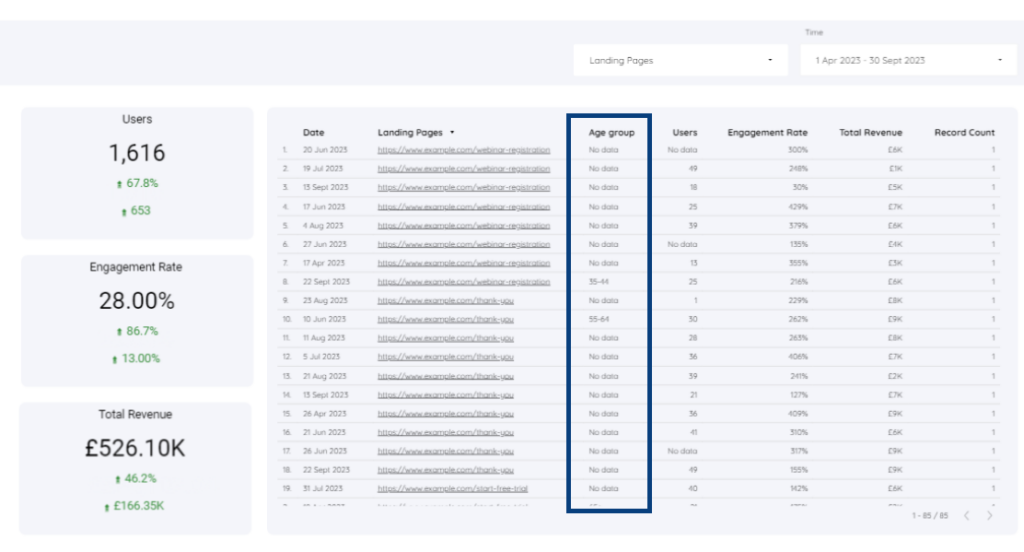
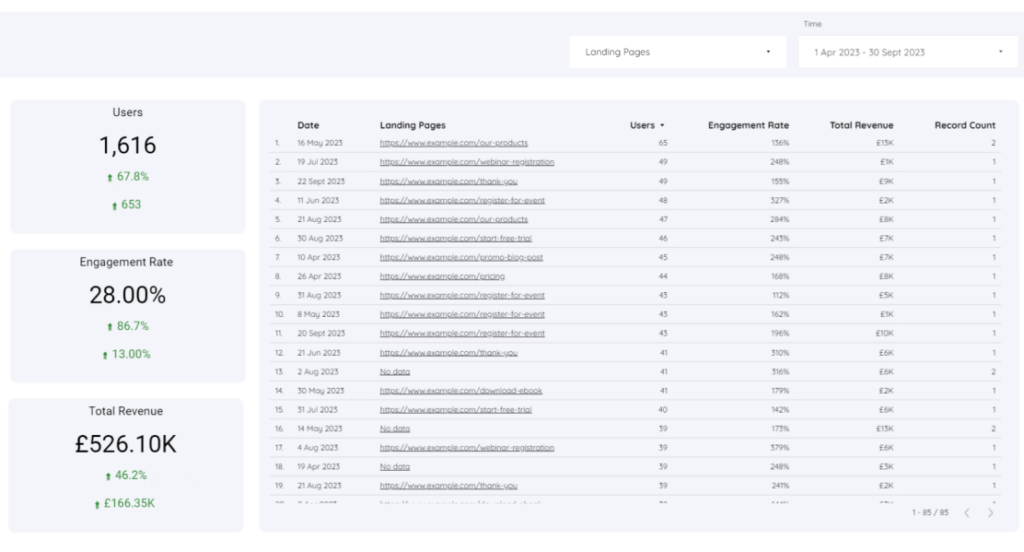
Finding missing data in Looker Studio tables can be tricky because it might have different names in the same column. To locate them, organize the data by clicking on the column heading, like ‘Age Group‘.
We have the No data value type.
When to Retain or Exclude Missing Data
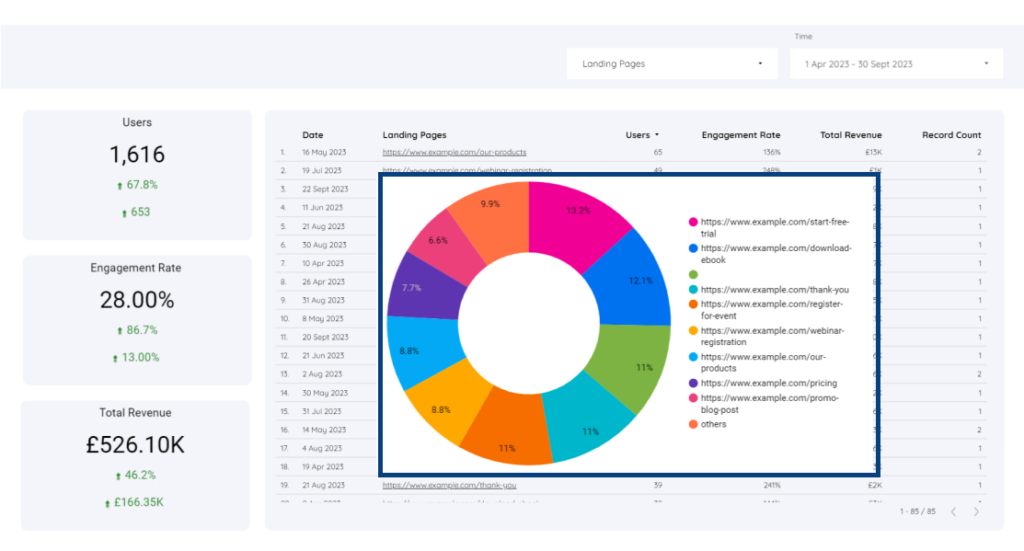
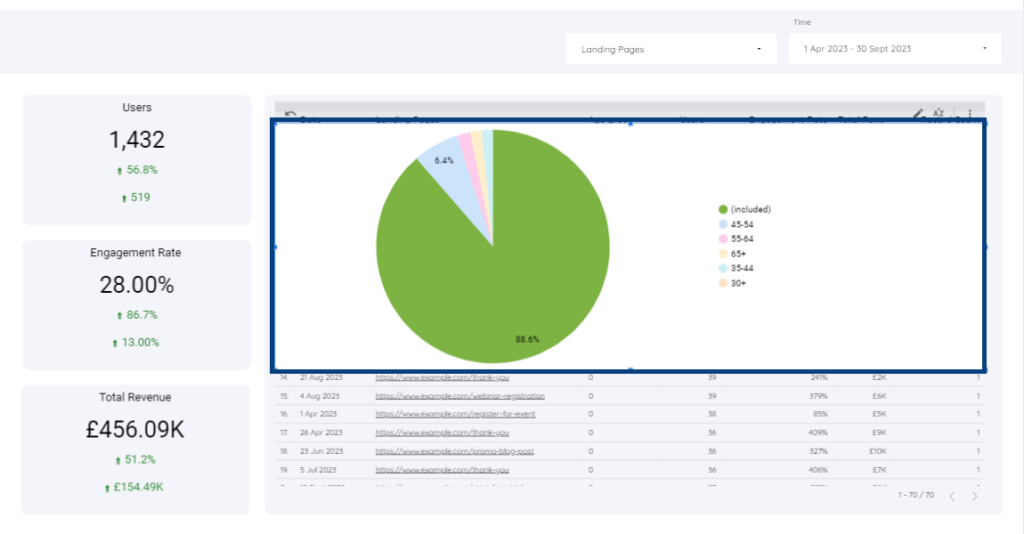
One helpful way to make this decision is by using a chart to see how much of the data is missing.
The donut chart below tells us how many landing pages are in our time series chart.
Take advantage of Looker's data modeling capabilities to create reusable views and explore data relationships.
Legend shows green dot for missing data.
Less than 20 % it is safe . There are 2 ways to fix the null values
Elevate Your Marketing Game with our Intuitive Website Master Template
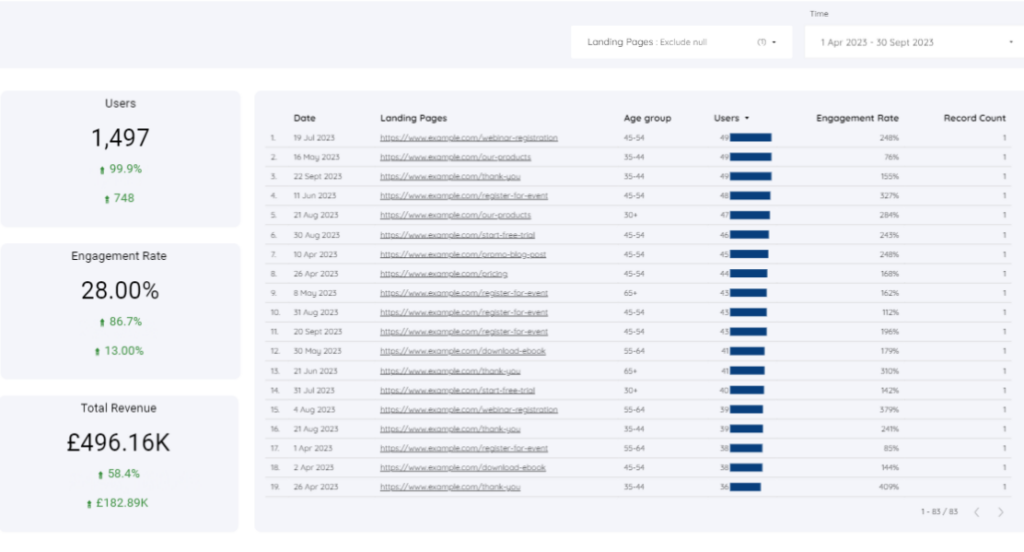
The initial approach involves employing a filter to exclude values.
Select the time series chart and click the “Add the filter “
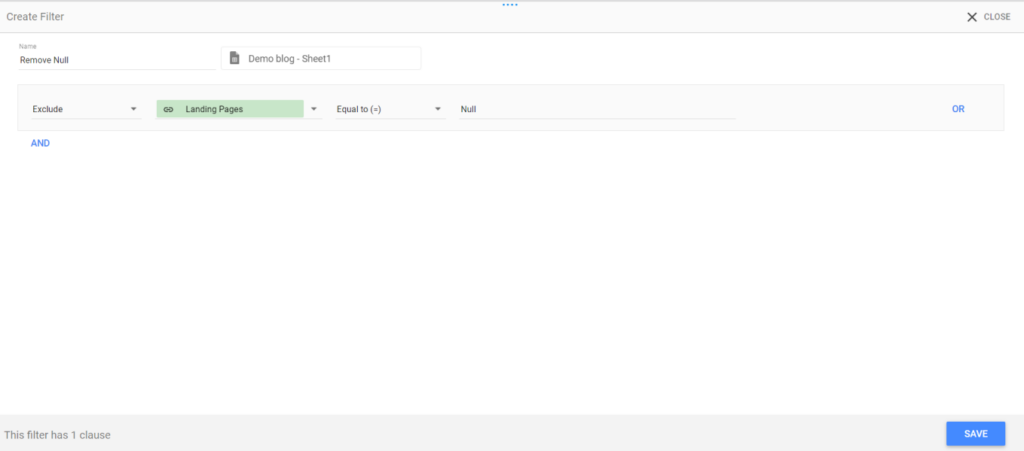
We’ll use the formula for the filter
Exclude Landing page Equal to (=) Null
Save the filter by adding a name
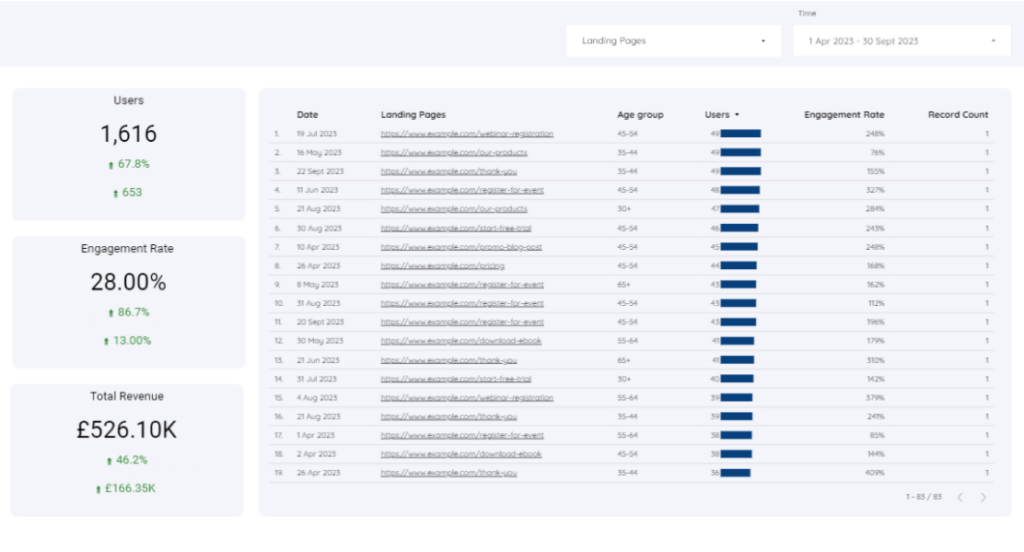
We took out the empty values from the chart but kept important data like revenue and the number of users.
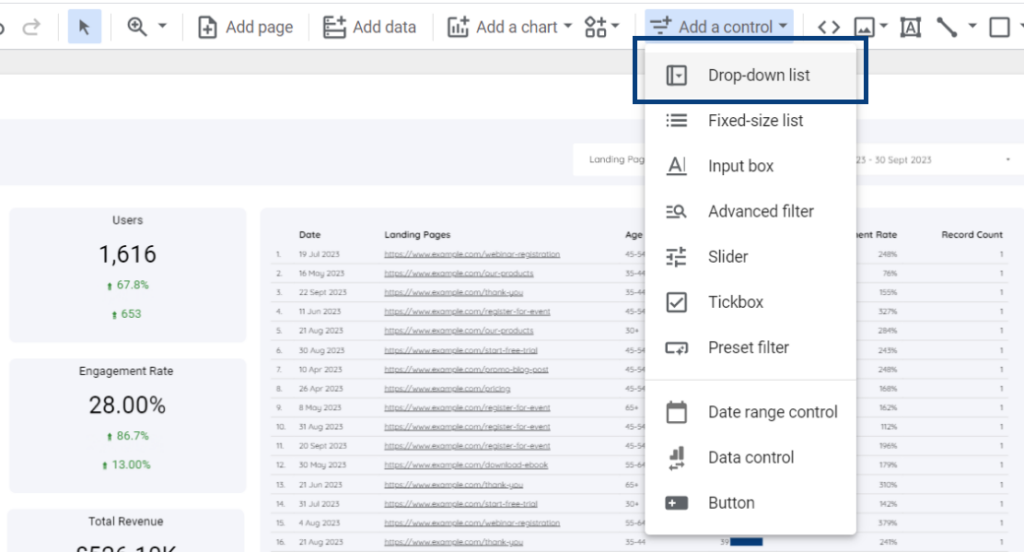
Introducing a Control for Excluding Null Values
Suppose we aim to remove 30% of missing data.
Click on the Add a Control and click the option “Drop-down list”
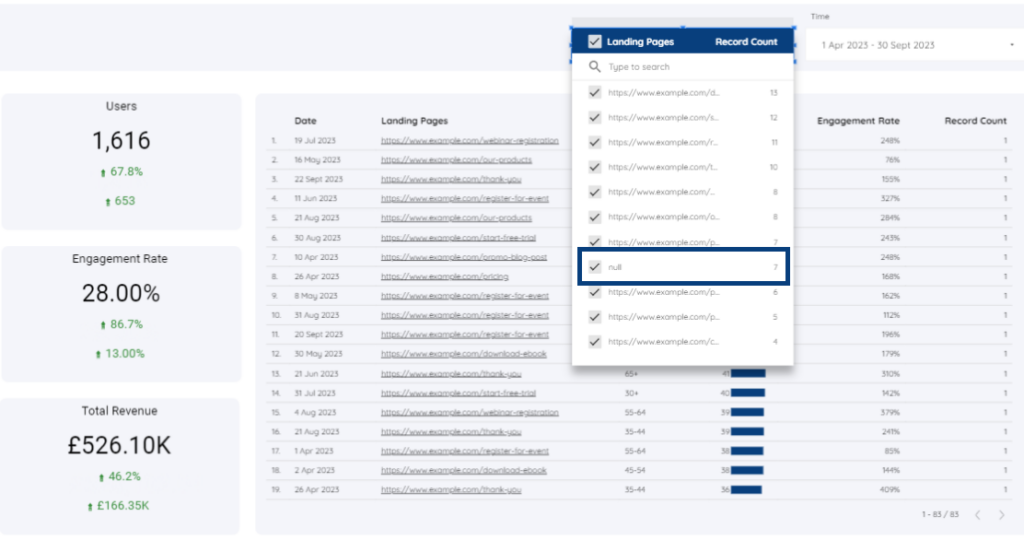
Next, include the dimension you want to study. In our case, it’s the landing page dimension, which is located next to our date range control.
When you click on the data control drop-down list, you’ll find a list of various landing page URLs in our report. Simply deselect the null values to get rid of missing data in Looker Studio
Now You’ll see the null values removed from the table chart .
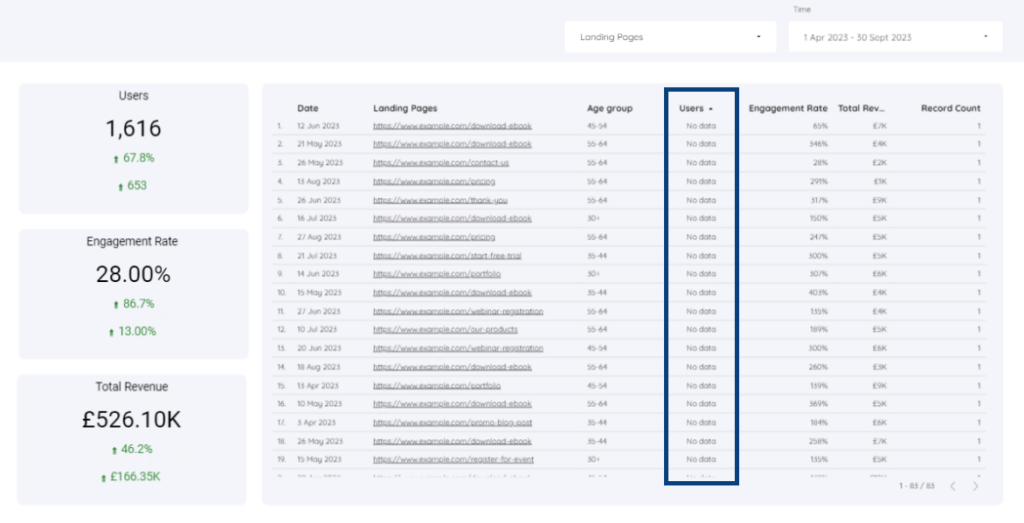
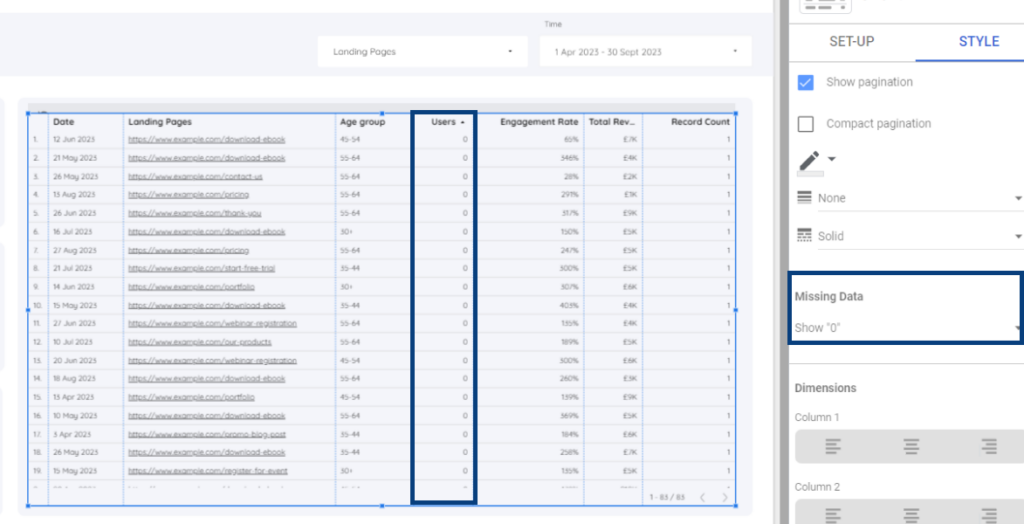
Looker Studio has a built-in way of handling empty or missing values in a table. When you look at the table, you’ll see that missing values are displayed as “no data.” You can also sort the table based on the “Users” column.
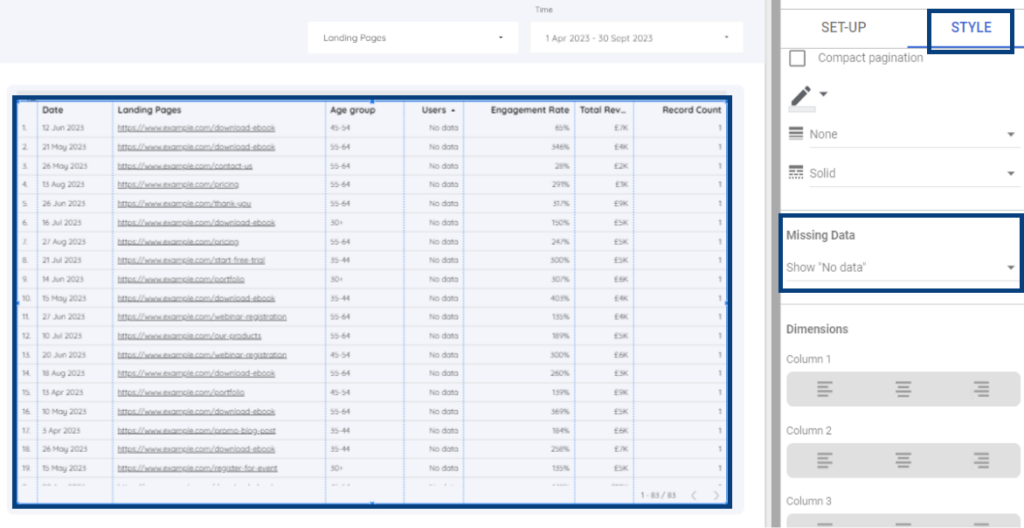
For metrics in a table, it’s a good practice to display missing values as zeros, and we can learn how to do this for our table.
Select the chart , go to style and scroll down to the missing data section.
In this section, you can choose how to present missing values in Looker Studio tables. We currently have it set to display “no data,” but to change this, simply select “Show 0” for the age group and users columns.
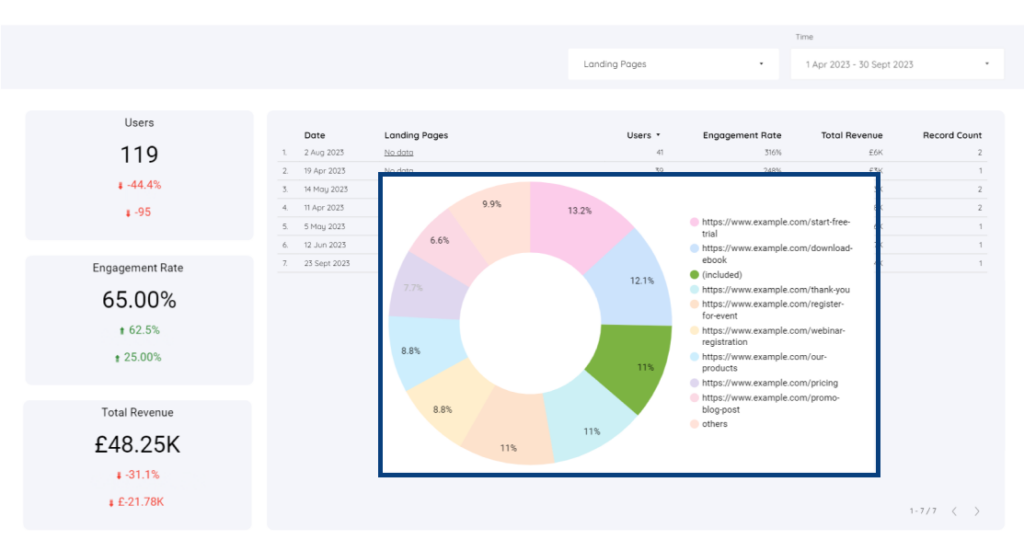
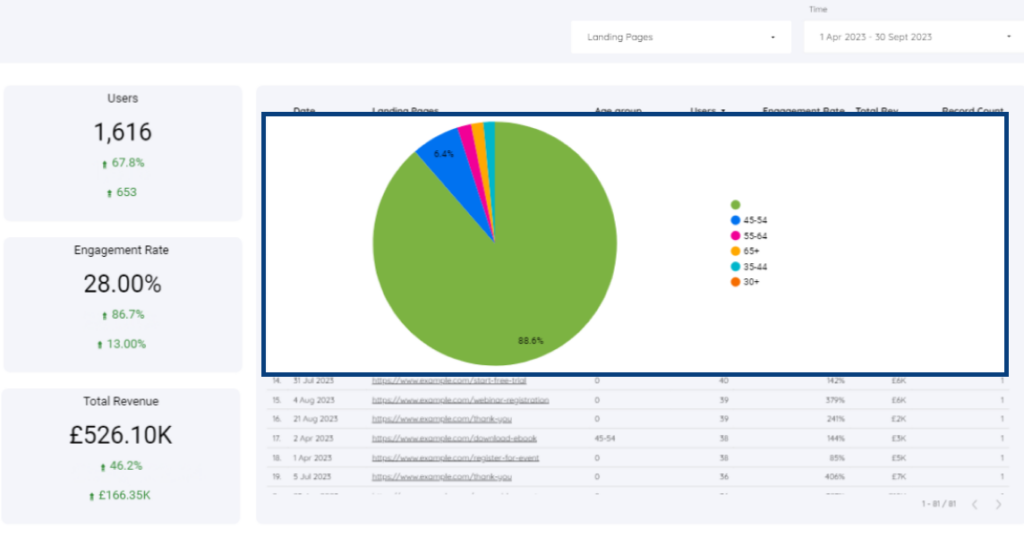
To illustrate the age group distribution, we added a pie chart.
To locate null values, click the green icon representing empty entries. In this case, about 88% of the data is missing.
As almost all the data is missing, the age group dimension becomes insignificant, and we should eliminate it from the report along with the pie chart.
Explore insightful data with ease using Looker Studio Templates. Click to view and analyze pre-built templates for actionable insights at your fingertips.