In this tutorial, we’ll show you how to connect LinkedIn company page analytics to Looker Studio using google sheets, enabling powerful insights for your business. Learn how to streamline your data analysis workflow and harness the potential of LinkedIn data within Looker Studio with ease.
Connect LinkedIn to Google Looker Studio for free using Google Sheets as the connector
Forward To >>
Export your company's LinkedIn analytics data to excel and update it to the sheets
Step 1: Go to LinkedIn, and click on the advertise button in the top right corner. If you manage multiple accounts, ensure that you clicked on a single profile you want to analyze. Click on the Analytics tab from the left menu panel.

Step 2: Select, export and download all the data sources as per your desired date range, then Import the .XLS file to Google sheets.
Data source: Visitors, Followers, Content
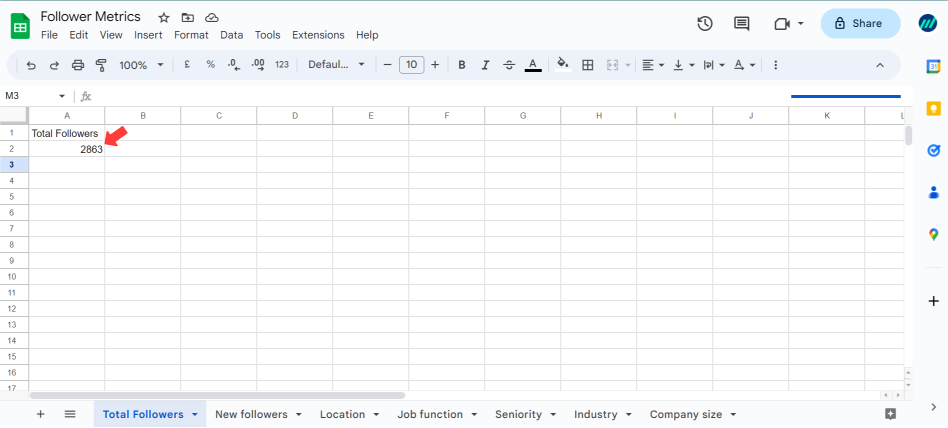
Note: Add a sheet to the Followers and update the Total Followers metric manually, this is because the exported sheets will have data only for the date range selected at the time of export and lifetime Followers are not available in such cases.

Optional: To automate the workflow you can make use of the following connector
This is the more convenient option and after setting it up once it allows you to pull in data automatically on an ongoing basis. If you are running ongoing campaigns and want dashboard access to real-time data, we suggest this is the better option.
Get the Supermetrics Connector
For any further enquiries please contact us
Importing data into looker studio
Step 1: Go to https://datastudio.google.com/u/0/navigation/datasources , click on “Create ” in the top left corner and select create new Data Sources as follows :

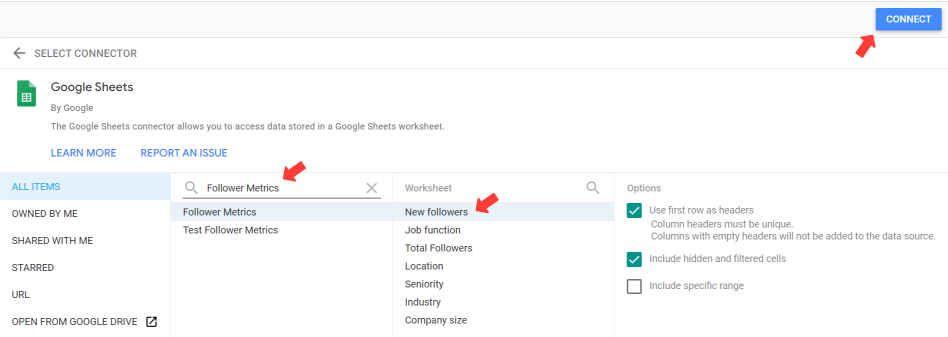
Eg; Data Source: All Items -> Followers Metrics -> Total Followers then click on connect and go back to the previous page, follow the same for the remaining data sources
Followers:
- Data Source: All Items -> Followers Metrics -> Total Followers
- Data Source: All Items -> Followers Metrics -> New Followers
- Data Source: All Items -> Followers Metrics -> Location
- Data Source: All Items -> Followers Metrics -> Job Function
- Data Source: All Items -> Followers Metrics -> Seniority
- Data Source: All Items -> Followers Metrics -> Company Size
- Data Source: All Items -> Followers Metrics -> Industry
Visitors:
- Data Source: All Items -> Visitor Metrics -> Visitor metrics
- Data Source: All Items -> Visitor metrics-> Job Function
- Data Source: All Items -> Visitor metrics-> Location
- Data Source: All Items -> Visitor metrics-> Seniority
- Data Source: All Items -> Visitor metrics -> Company Size
- Data Source: All Items -> Visitor metrics -> Industry
Content:
- Data Source: All Items -> Content Metrics -> Metrics
- Data Source: All Items -> Content metrics-> All posts
Note: When the data is downloaded the Date field in the respective resources is in the string format, in such case follow the steps below
Step 2: Go ahead and add two fields by clicking on “Add A Field “
1] Parse_Date
PARSE_DATE(“%m/%d/%Y”, Date )
add the custom field “Parse_Date” for all the date-related data source
2] Parse_Date
PARSE_DATE(“%m/%d/%Y”, Created date )
add the custom field “Parse_Date” for created date in Content metrics >> All posts data source

Change the data type of Location from “Text” to “Geo >> country” where ever required
Connect LinkedIn Data to Looker Studio
Adding the Data sources to Looker Studio
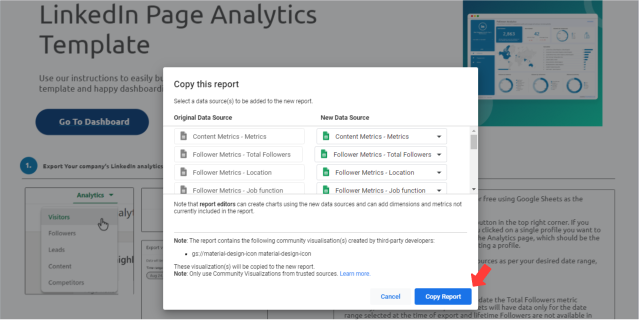
Step 1: Hover over the header of the report and click on the “three dots” for more options, then select “Make a copy” . Replace your Data sources accordingly in the New Data Source. Finally, click on the “Copy Report”.

Now you’re ready to use your own LinkedIn Company Page Analytics Report.


