
One of the most used digital marketing tools is Facebook Ads, and for good reason. An average advertising campaign should provide $3–4 for every $1 invested, with a return on ad spend (ROAS) of 3–4x.
But to get that kind of return on investment, you need an approach to track the results of your advertising campaigns and modify them as needed. If you monitor Facebook advertising for your customers, you need to be able to evaluate results and present information understandably.
A detailed guide on Facebook Ads reports.
What are Facebook Ads reports?
A Facebook Ads reports is a marketing report that provides all the information you require to assess and improve your Facebook paid advertising campaigns. Every advertising campaign has a goal, such as increasing conversions, raising brand awareness, or increasing the number of website subscribers in the case of a top-funnel campaign.
You may create one or more ad sets under each campaign, each with specific features like targeting and budget. Additionally, you can have distinct ad sets for particular age and gender groups.
Next, you can have one or more ads below each ad set, which may have a different copy version that runs against the other in an A/B test.
Metrics to use in your Facebook Ads report
It would help if you decided which Facebook Ads metrics to track before you can create a report on them. These are the most important ones:
- Cost Per Result
- Ad Impressions
- Ad Frequency
- Ad Clicks
- Click-Through Rates
- Cost Per Click and Cost Per Impression
- Conversion Rates
- Cost Per Conversion
- Ad Spend and Return on Ad Spend or ROAS
- Total Conversion Value
- Cost Per Action (CPA)
- Relevance Score
Start with a Facebook Ads report template
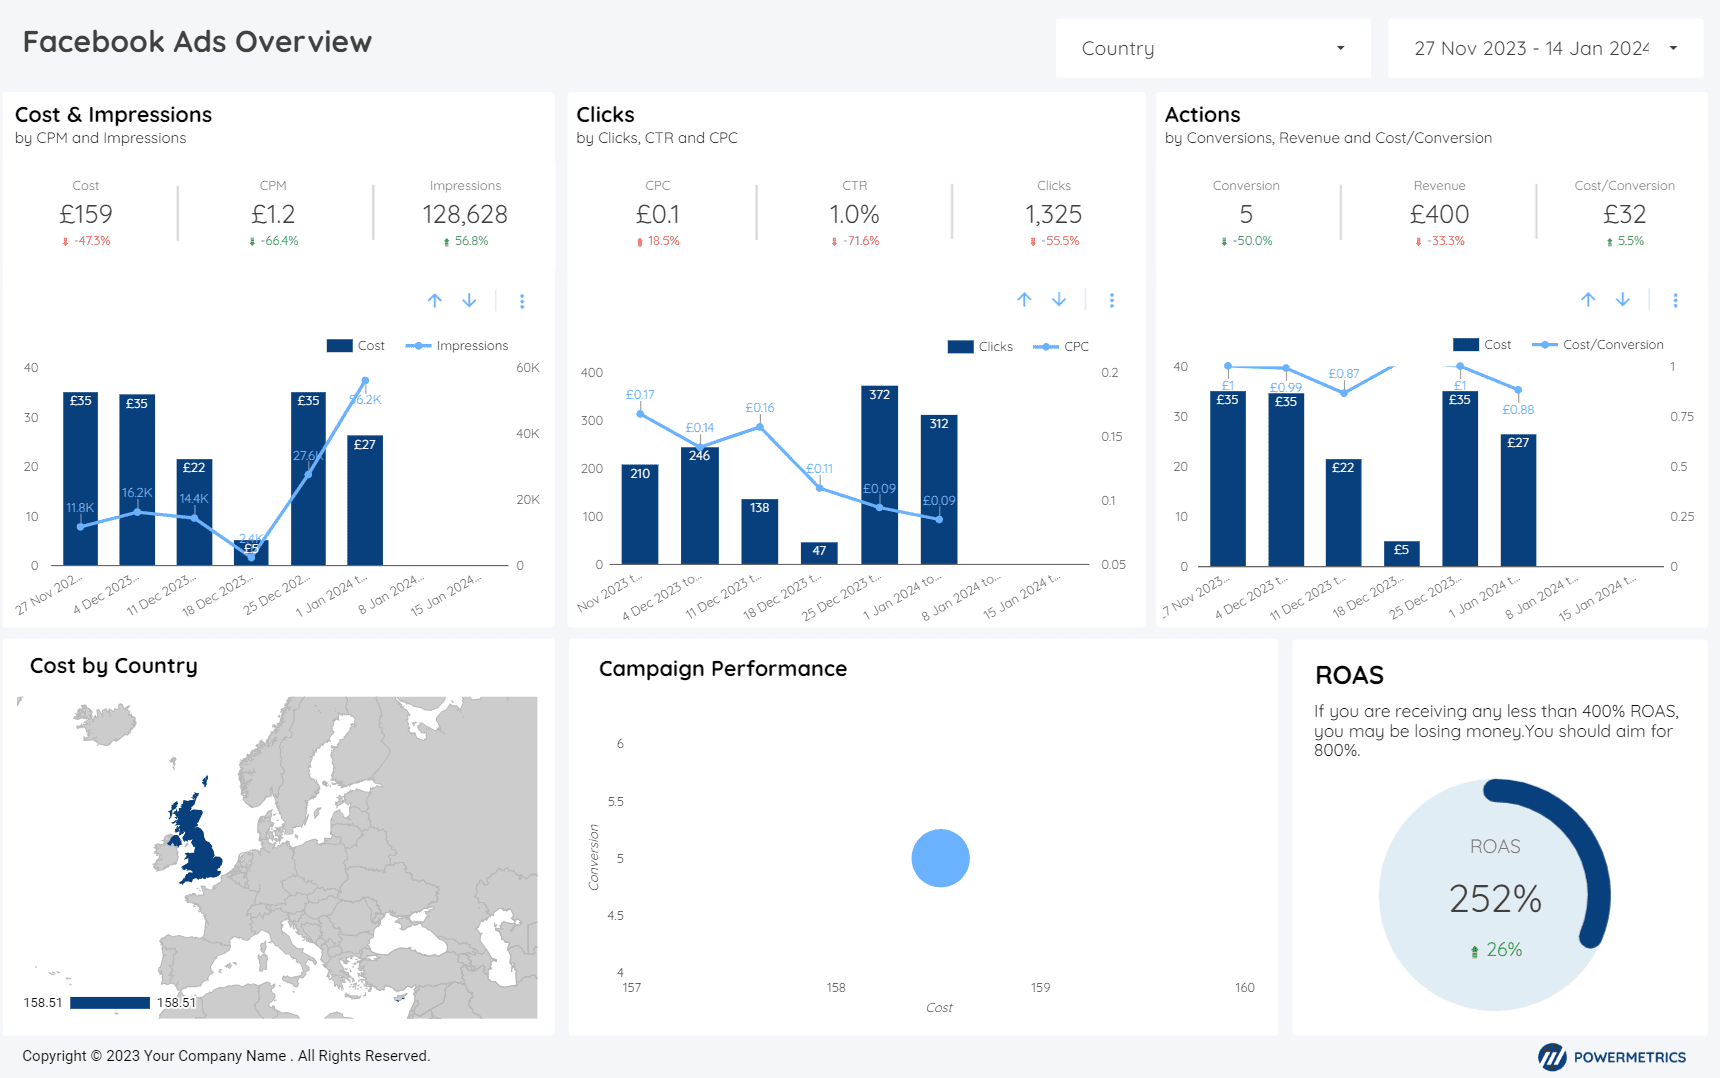
The Powermetrics Facebook Ads template is made to meet your customers’ demands. It tracks ad set data and provides a comprehensive snapshot of your Facebook Ads account performance.
You can display information on the effectiveness of your advertising campaign with this template. Emphasise the audience demographics, cost per result, relevance score, and ad impressions.
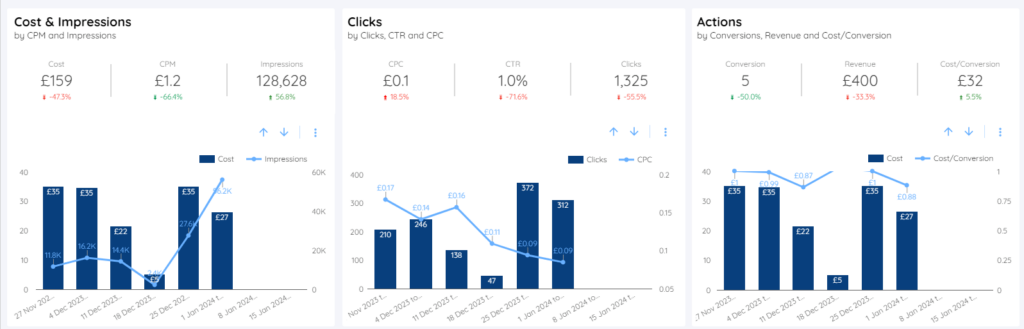
Performance overview:
KPIs include spending amount, clicks, impressions, CTR, and CPC (cost per link click).
Engagement overview:
Engagement, Reactions, Monthly Campaign Performance, and Engagement.
Ad performance:
Top 6 best Facebook ads by Link clicks and CTR effectiveness.
User and media insights:
Ad breakdown by gender, age, device, and platform placement.
Conclusion:
Use our Looker Studio Dashboard to step up your Facebook advertising game. It’s your go-to tool for successful Facebook ads, and it comes with committed support to make integration easier!