
Conditional formatting is a powerful tool in Looker Studio that enhances data visualization, aiding in better decision-making. It allows for customized styling in charts, highlighting crucial information, spotting outliers, and emphasizing trends. This feature streamlines data analysis, as visual representation often conveys more than a thousand words.
Forward To >>
Conditions accessible in looker studio
Looker Studio provides diverse conditions for conditional formatting, applicable to both rows and individual fields. Formatting options include single background or text colors, color scales, and variations based on specified rules. The conditions cover numbers, text, percentages, and decimals, offering flexibility for customizing data appearance.
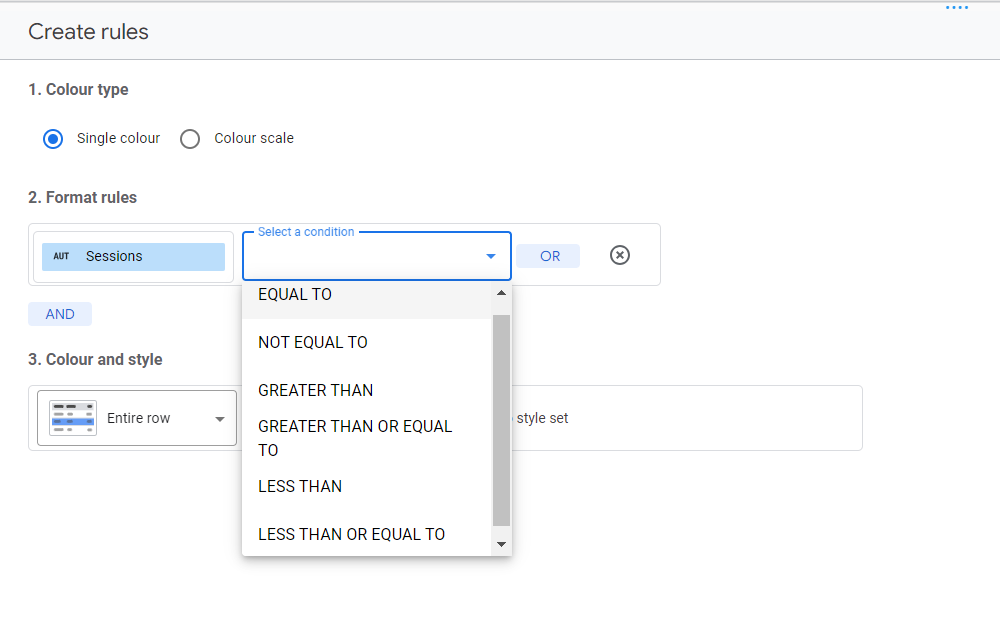
The available conditions include:
- EQUAL TO / NOT EQUAL TO
- GREATER THAN / LESS THAN
- GREATER THAN OR EQUAL TO / LESS THAN OR EQUAL TO
- EMPTY / NOT EMPTY
- IS TRUE / IS FALSE
- CONTAINS / DOES NOT CONTAIN
- STARTS WITH
- REGEX
The rules for conditional formatting can range from simple to complex, with the flexibility to use AND or OR statements for precise customization.
How to implement conditional formatting?
Here are three steps on utilizing conditional formatting in Looker Studio:
- Generate a Chart: Create a visualization in Looker Studio, such as a regular table, pivot table, or scorecard.
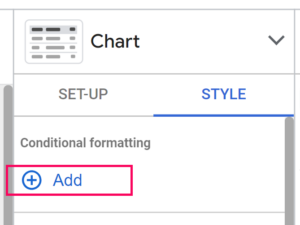
- Integrate a Rule: After creating a chart, go to the “Style” tab, and select “Add” under the Conditional Formatting section.
3. Define Formatting Rules
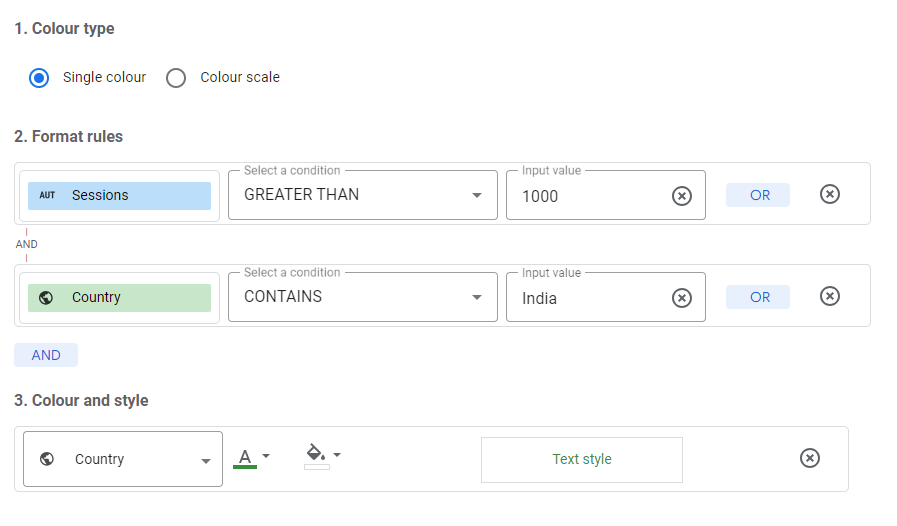
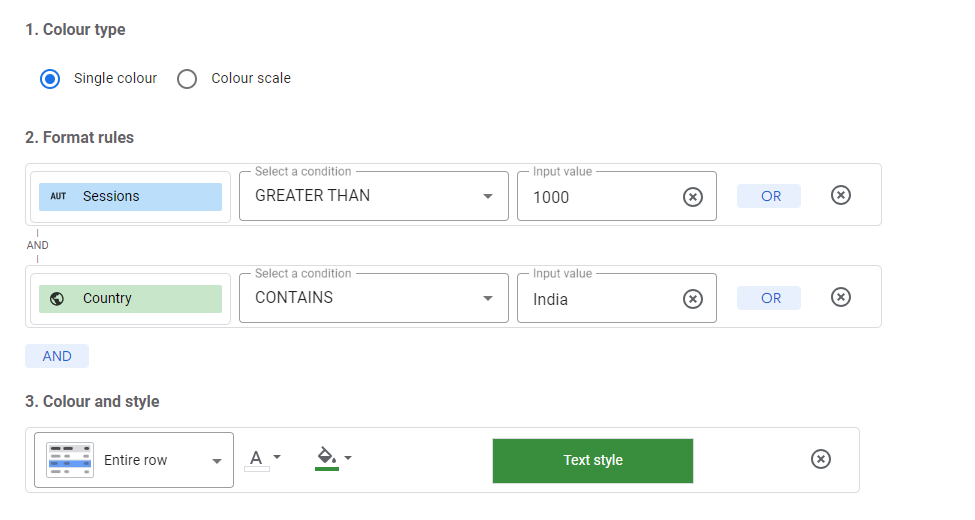
In the new window, specify conditions for applying formatting in Looker Studio. Options for defining conditions include thresholds, color scales, and styling. To create the rule:
- Choose Color Type: Select either a single color or a color scale. For instance, opt for a red-to-green color scale to highlight high and low values for a specific metric.
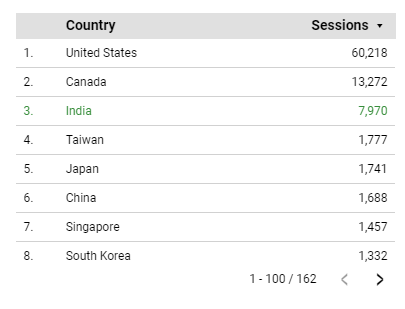
- Add Formatting Rules: Define values and conditions for a metric or dimension. For example, set a threshold of 1000 sessions from Country and apply green text when this condition is met in a table. Use custom expressions for varied formatting based on specific criteria, such as Channels.
- Select Color and Style: Choose the appropriate color and style for your rules, applicable to the entire row, metric, or dimension level.
By following these steps, you can precisely tailor the appearance of your data in Looker Studio based on your specific criteria.
Another method for conditional formatting involves highlighting the entire background row. Follow the same steps mentioned above until adding formatting rules. After that, select white as the text color and apply green or red as the background color based on the rule. This approach enhances visibility and emphasizes the specified conditions for the entire row.
4. Prioritize Rules
For multiple rules in Looker Studio, arrange their order thoughtfully. Drag and drop conditions in the list, as the rule lower down takes precedence over earlier ones, shaping the final formatting outcome.
Elevate Your Marketing Game with our Intuitive Website Master Template
When to apply conditional formatting?
While conditional formatting can enhance visual appeal, it is most effective when strategically applied:
- Engagement Improvement: Apply when colleagues or clients aren’t comprehensively engaging with reports to make crucial information stand out.
- KPI Presentation: Highlight Key Performance Indicators (KPIs) compared to targets using color backgrounds.
- Performance Drivers: Identify underperforming products with a color scale to emphasize sales below a specific threshold.
- Issue Flagging: Set rules to flag potential issues, such as bounce rates below 10% or above 90%, with red indicators.
- Trend Identification: Use color scales to emphasize changes in sales over a specific period, identifying products or regions with increasing or decreasing sales.
Conditional formatting example
An example of effective conditional formatting is demonstrated through the GA4 Audit tool in Google Looker Studio:
In this example, conditional formatting is applied to indicate whether each check passes or fails. The conventional color scheme of green for pass and red for fail helps users quickly assess the readiness of each check.
Strategically using color directs attention to the crucial pass or fail section instantly. The comprehensive audit provides actionable insights when a check fails, facilitating easy identification of solutions to the identified issues. This effective visualization is made possible through the implementation of conditional formatting in Looker Studio.
Recent posts